
The MQ series are cheap gas sensors.
They are resistive electro-chemical sensors.
These sensors have a heating element and a resistance that react to gases.
Below a MQ135 sensor opened. Inside it looks like that.

To read the sensor's resistance, we measure the voltage drop of the sensor.
The method we use to measure resistance on the micro is by using the ADC, and a pull-up (or pull-down) resistor. Here http://electronics.stackexchange.com/a/70012 you can find a good explanation on the pull-down/up method on reading resistance.
Some people are asking me in my previous post about the MQ135 sensor, http://davidegironi.blogspot.it/2014/01/cheap-co2-meter-using-mq135-sensor-with.html how to obtain correlation function for other MQ series sensor, or other gas.
In this post I will explain a simple (to me) method of obtaining correlation function for any MQ series sensors that fit an exponential function.
An italian version of this article has been published in the may number of Elettronica In (http://www.elettronicain.it/) magazine.

As a reference, let's consider the MQ135 sensor (again).
We will look at the "sensitivity characteristics of the MQ-135" figure of the datasheet.

Notice that it's a log-log plot, this means that is has logarithmic scales on both axes.
Another thing to notice, is that the y-axis is for Rs/Ro, it will be much clearer if we impose ppm on the y-axis.
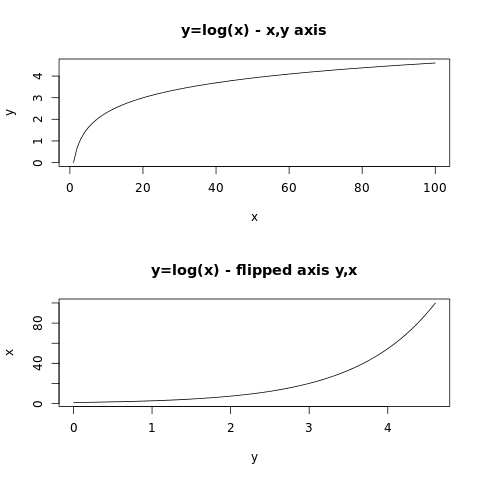
So as a first step, we will flip the axis.
As a reference, above we will see a flip axis example
Now, let's take a look at a power function with different exponents.

Let's try to plot those function on a log-log scale.

You may notice that an exponential function flipped is again an exponential function, with different coefficient of course.
As you may see, the power function with a negative exponent looks like the one we are searching for.
Summarizing, let's take the power function y=x^-2 and plot this on the log-log scale, with a 10 multiplier

We are searching for something like:
y=a*x^b
with b<0
Now, our purpose is to find out the value of the a and b constants, starting from the datasheet figure.
We can do this by performing a nonlinear regression. Specifically we need a power regression.
First, we need to collect values from the datasheet figure.
WebPlotDigitizer is the tool we are going to use here: https://github.com/ankitrohatgi/WebPlotDigitizer. We can find few online tutorials that teach us how to use WePlotDigitalizer. I will try here to sum it up here:
1) extract the figure from the datasheet
2) load the figure on WebPlotDigitalizer
3) set axis, remember to se axis both as log
4) check out points from the curve of the gas you need to found
5) click on the view data button, and you get the points you need.
Now that we have found out the points of the curve from the datasheet, we need something to load with those points and perform a power regression.
You can use matlab or you favorite math software tools. There are also other online tools you can use to perform power regressions. Here I will use an R (ref. https://en.wikipedia.org/wiki/R_(programming_language)) script I've write.
You just have to load the points values you have found out, and launch this R script. You can also launch it on http://www.r-fiddle.org/.
The script will find out the function coefficients (a and b), and print out the function found next to the graph points, just to check the function's accuracy.
Below the Rs/Ro vs ppm function, as seen on the datasheet.

Then the flipped function we are searching for

Then, the plot of both functions on linear scale axes:


Now we have to estimate the Ro coefficient.
Ro estimation is quite simple
We just need to solve this equation for Ro
ppm=a*(Rs/Ro)^b
Ro=Rs* sqrt(a/ppm,b)=Rs*(a/ppm)^(1/b)
note: in my library here: http://davidegironi.blogspot.it/2014/01/cheap-co2-meter-using-mq135-sensor-with.html i simply Ro as Rs*sqrt(a/ppm,b) = Rs*exp(ln(a/ppm)/b), which is the same that Rs*(a/ppm)^b.
So given the function coefficients, we have to measure the resistance of the sensor at a know amount of ppm for the gas we are investigating.
Now, just substitute the found function coefficients (a and b), the resisteance we have read (Rs in ohm) at the amount of gas (ppm) to the estimation Ro function
Ro=Rs*(a/ppm)^b
One last step is to provide the Rs/Ro limits we are going to use to validate the input for our solving function ppm=a*(Rs/Ro)^b
We know that Rs/Ro=(ppm/a)^(1/b)
So
min[Rs/Ro]=(max[ppm]/a)^(1/b)
max[Rs/Ro]=(min[ppm]/a)^(1/b)
By the datasheet figure we have to select the max and min Rs/Ro and ppm points.
Notice that we get the max Rs/Ro value for the min ppm point value.
Here you can find the R script to estimate correlation function coefficients, compute Ro, min and max Rs/Ro (input: x/y axis limits, correlation function points, resistance of the sensor in ohm at a know amount of gas in ppm).
On gist: https://gist.github.com/davidegironi/b7be6b7cace6b475dd42c48c3e62fcf4
Above an implementation of the raw value to ppm conversion, sample sketch for Arduino:
//sensor input PIN
int mqInput = A1;
//pull-down resistor value
int mqR = 22000;
//rO sensor value
long rO = 41763;
//min value for Rs/Ro
float minRsRo = 0.358;
//max value for Rs/Ro
float maxRsRo = 2.428;
//sensor a coefficient value
float a = 116.6020682;
//sensor b coefficient value
float b = -2.769034857;

void setup() {
  pinMode(mqInput, INPUT);
  Serial.begin(9600);
}

void loop() {
  int adcRaw = analogRead(mqInput);
  long rS = ((1024.0 * mqR) / adcRaw) - mqR;
  Serial.print("Rs: ");
  Serial.println(rS);
  float rSrO = (float)rS / (float)rO;
  Serial.print("Rs/Ro: ");
  Serial.println(rSrO);
  if(rSrO < maxRsRo && rSrO > minRsRo) {
 float ppm = a * pow((float)rS / (float)rO, b);
 Serial.print("ppm: ");
 Serial.println(ppm);
  } else {
 Serial.println("Out of range.");
  }
  delay(1000);
}
You can find the temperature and humidity correlation function here: http://davidegironi.blogspot.com/2017/07/mq-gas-sensor-correlation-function.html
Notes
- read risk disclaimer
- excuse my bad english
This comment has been removed by the author.
ReplyDeleteThis comment has been removed by the author.
ReplyDeleteSir please correct me if I am wrong
ReplyDeletefirst we have to calculate the value of scaling factor and exponential by using the R script you gave then we need to find the value of Ro for our sensor so we need to write the equation you gave for Ro and Rs/Ro and upload it to arduino and wait until 24 hours. After that we have to see the value of Ro and Rs/Ro by defining it as constant and then we can calculate ppm value.Sir please correct me if I am wrong
Hello. It something like this. You can use the R script to get the "a" and "b" factor, and also the Ro value by reading the resistance of the sensor (heated up for a few hours) at a know value of ppm. Then you can upload all to Arduno. By datasheet the sensor did consisten readings after 24 hours although it may takes just an hours to get good reading to me.
DeleteExcuse, how you get the value of RO =41763 ? I still confuse
DeleteThis comment has been removed by a blog administrator.
DeleteHello, Ro value is derive by the "a" and "b" factors for you gas curve, and the know amount of gas "ppm" reading the sensor resistance "Rs", in other words solving the formula: Ro=Rs*(a/ppm)^(1/b).
DeleteHello, Eng. Davide
DeleteHow to measure "mres" or sensor resistance at a known amount of gas for example 408 ppm of CO2?
Hello Jimmy, you could use you microcontroller ADC and measure resistance (this may help: https://learn.adafruit.com/thermistor/using-a-thermistor) or you could simply use a multimeter. Hook up the power line of this sensor, the measure resistance between pin A and B
DeleteHi Mr. Gironi i still confuse about the pull down resistor value that you got, how can you got the pull down resistor value mqR is 22000? thank you
DeleteHello, to understand how resistance measuring works using the ADC of your micro, read the adafruit blog post link posted in my comment above. Said this, the voltage you are going to read on your ADC pin will Vo=R/(R+Rpd)*Vcc. I'm going to use an ADC Ref Voltage of 5V. From datasheet MQ135 will output value from 30k to 200k Fixing a 22k Rpd, we get on our ADC pin voltage between 2.9V and 4.5V, which is a good enought range (with ADCRef of 5V you can read between 0V..5V. You can "extend" this range of course using other Rpd.
DeleteHi sir from here Ro=Rs*(a/ppm)^(1/b). I understand Ro = Rs*(116.6020682/ppm)^(1/-2.769034857). So may i know how to measure the rest such as Rs and PPM to get my Ro? For your information, the RS isit derived from this equation? long rS = ((1024.0 * mqR) / adcRaw) - mqR; if yes, may i know how to get the value of mqR ? In fact , im using a MQ2 module which having a sensor mounted on the board
DeleteHello Sir, can you explain how to find this values below ?
ReplyDelete//pull-down resistor value
int mqR = 22000;
//rO sensor value
long rO = 41763;
//min value for Rs/Ro
float minRsRo = 0.358;
//max value for Rs/Ro
float maxRsRo = 2.428;
//sensor a coefficient value
float a = 116.6020682;
//sensor b coefficient value
float b = -2.769034857;
Hello Raka, you can take a look at the blog description above and the related video, it's all there.
DeleteDear Davide,
ReplyDeleteI was wondering how you came to a known value of ppm for a gas (CO2/NH4 etc.). Did you leave your sensor outside/inside and find the relative/general values of the ppm from references like google or the internet. I understand there is some percentage in the air that stays relatively constant. Otherwise I would like to know how you knew exactly what amount of ppm you put into the sensor without using another sensor to measure it! :)
Thank you very much in advance,
Naomi
Hello, it really depends on which gas are you trying to measure. For CO2 it was quite simple https://www.co2.earth/, for other gases, you must have a calibrated sensor or a tricky way to get a know amount of gas.
DeleteThank you for the fast reply. I think for the scale of my project the ship for the other gases has sailed. after a little bit of googling I also come to the same website. Thanks for sharing the website. Have a great evening :)
DeleteHow to get the value of RO = 41763 ?
ReplyDeleteHello, look at my reply "June 13, 2017 at 7:51 PM".
DeleteThis comment has been removed by a blog administrator.
ReplyDeleteHi Davide,
ReplyDeleteHow did you determine the RL value of the sensor? In the datasheet it says its adjustable and the sensor I have does not have the 6 pins but is attached to a blue sort of board and has 4 pins. I have no clue on how to determine the RL or is this an exterior resister I can add myself to the A0 to the Ground?
Hello, Rl is the load resistor. As example in the MQ135 datasheet it is stated to chose a value between 10k to 47k). It's a pull down resistor, take a look at the schematics here http://davidegironi.blogspot.it/2014/01/cheap-co2-meter-using-mq135-sensor-with.html
DeleteHi, first of all thanks for this nice article!
ReplyDeleteI bought the following mq135 module: http://www.ebay.de/itm/MQ-135-MQ135-Air-Quality-Sensor-Hazardous-Gas-Detection-Module-For-Arduino-AVR-/172115034015?
I (kind of ;) ) understood all the calculations but I am not sure how to set up the values from the module.
Can you give me any help?
Thanks,
Pedro Scaff.
Hello and thank you. You can use the sketch provided in this post as a starting point.
DeleteHello sir, I want to ask, is the program code can be used for sensor MQ-7?
ReplyDeleteHello, yes. The MQ-7 follow the same principles of this sensor. You have just to built up the conversion points, and the compute factors for the sensor you are using and the gas you would like to trace.
DeleteBefore I apologize if my language is still wrong, I want to introduce myself first, I am chan heldo, I come from Indonesia. I have the final task to make a CO gas detector using MQ-7 sensor. But I am still confused in making arduino program code for the MQ-7 sensor. I hope you can help me in making the program code. thank you
DeleteSir, why after I follow the above steps, but does not appear the ppm value in view?
DeleteHello, at first you have to check it out the factor you have found by simply reading the resistence of the sensor with a multimeter and applying the conversion formula with the factor values found. For CO and MQ-7 of course you can not use the a,b Ro value that I provide as sample, but you have to find your how using the method of this blog post.
DeleteHi Sinaga, hi Davide,
DeleteI just worked through the MQ-7 and I got the values for MQ-7 CO (not the heater/RL values, I used a module that already does this part). I didn't do a power regression since there were two points that were exactly marked on the data sheet. Here is the octave/matlab code and the final equation:
% Inverting x and y axis, points on data sheet: `p0 = (0.09, 4000)` `p1 = (1, 100)`
% the x axis represents the ratio Rs/R0
% the y axis represents the ppm CO concentration
% https://en.wikipedia.org/wiki/Log%E2%80%93log_plot
% a straight line on a log-log plot can be represented as a power function
% where the slope m = log(y1,y0)/log(x1/x0)
% and the equation for Y = a * (x^m)
% for the point (1,100) we have a = 100
% octave code for the slope m
x = [0.09, 4000]
y = [1, 100]
m = log(y(2),y(1))/log(x(2)/x(1))
% our final equation for CO ppm concentration is
% ppm = 100 * (Rs/R0)^-1.53
% from data sheet: Rs/Ro = (Vcc - VRL) / VRL
Thanks for this post, Davide, it has been very helpful for my bachelor thesis :). I also used this post as a helper, and I guess I corrected the value he found there a little bit ;): http://forum.arduino.cc/index.php?topic=294085.0
This comment has been removed by the author.
Deleteand complementary from the post on the arduino forum I mentioned above:
DeleteRs = RL * (VCC / VRL - 1)
ppmCO = 100 * (RL/Ro * (VCC/VRL - 1))^-1.53
Hello Pedro. Thank you for your feedback and thank you for sharing your results here. Congratulations for your thesis.
DeleteHi pedro, thanks for your response Have you ever designed a tool using the MQ-7 sensor? Can you help me to complete my task? and Can you give me your email? Or you can chat with me at sinagabonor2320@gmail.com. Sorry if my language is still wrong
DeleteHi @Pedro, i wonder know how you get the a and b from the equation that you provided here? x = [0.09, 4000]
Deletey = [1, 100]
This comment has been removed by the author.
ReplyDeleteHi,
ReplyDeleteI am having hard time for converting analog data from Aurdino sensor to ppm. I am using MQ131 ozone sensor. Can I apply same steps shown in this blog for MQ 131 sensor?
Hello, yes you can apply all the proposed steps, but for calibration you have to know the O3 ppm and of course the resistance of the sensor.
DeleteHi Davide,
DeleteDo we measure the resistance between "ground pin" and "analog pin" in the sensor to get "mres" if we know the value of ozone ppm?
Hello, power up the sensor header (one Hpin to GND, the other to VCC), then read with a multimeter the value between A and B pin. Start with a multimeter and a spreadsheet, then you can go through a microcontroller.
DeleteHi Davide, I am working with ozone sensor and i could not understand how "long rS = ((1024.0 * mqR) / adcRaw) - mqR;" came in the formula. I am using the same formula as in your blog, just changing the values and I am not sure if it is correct because it does not match with the photometric ozone analyser that we have in our university. I was wondering if you can explain "long rS = ((1024.0 * mqR) / adcRaw) - mqR;" line in the formula.
DeleteHello, that is the ADC raw value to resistance value conversion formula for a 10bit adc. Take a look here: https://learn.adafruit.com/thermistor/using-a-thermistor it may help.
DeleteHi Davide,
ReplyDeleteI am working with MQ-4 sensor. In your video at 3:08, you mentioned a value of 26954 ohm at 392 ppm. Where did you get that value?
How can I get this value for MQ-4 sensor to calculate methane in ppm. You help would be highly appreciated.
Hello, you have to measure the resistance of the sensor between A and B pin when it's in a know amount of gas. In my example it was in 392ppm of CO2, and i measure 26954ohm. You have to put your sensor in a know amount of methane and measure the resistance of it, please be carefull with CH4.
DeleteIf We use the values obtained from graph provided with datasheet with the help of WebPlotDigitilizer, Will it not be sufficient to get ppm value with marginal accuracy?
DeleteHello, it depends on what you mean with sufficient. Also it depends on the gas you are trying to measure. Let's say you get a relistic idea of what it could be the gas amount in ppm :)
DeleteDear David,
ReplyDeleteI was trying to reproduce your project for measuring CO2. I followed the same process you explain on the video, i've got the following values:
rO = 42842; a = 111.336; b = -2.716215;
which are sufficiently close to those you're reporting.
The problem is that i am obtaining Rs/Ro values around 7 and they continue incresing (now they are around 20) thus going further from the maxRsRo = 2.428. Of course the result is an "out of range" message.
However, i also performed the same process using the values of r0, a and b that you are using.
What are the chances that I am doing wrong?
Thank you in advance for your help.
Hello, at first connect you sensor and measure the resistance of the sensor using a multimeter. Then check that your resistance value measured on your micro is almost the same. You should get a resistance value on range, if not it could be your sensor. A valid resistance should be something around 30K.
DeleteHello Mr. Gironi,
ReplyDeleteMy question is regarding the why's and how's of the adc and pull up resistor wiring configuration to get a reading for mrcs and mppm. I read through the link you've included and am still a little lost. Second, the configuration I'm using is a resistor that goes from the power rail to the 5V input on the mq sensor. this resistor is in series with another resistor that is connected to the A0 pin on the sensor. Am I close to correct configuration or completely off?
Hello, the pull up it is used to read a resistance, here is the MQ resistance. We need the sensor resistance cause we use it to calculate the ppm. You can experiment heating the sensor up with a power supply between H pins, and then read the resistance between A and B pin using a multimeter, the resistance you read should be the same that you observe on the microcontroller side. Here you can find a good explanation on the pullup resistor usage and reason for use them https://electronics.stackexchange.com/questions/70009/why-use-a-pull-down-resistor-with-a-ldr-and-microcontroller . I really do not understain to much of your circuit, there should be no resistor in series to to me, you circuit should look like this one https://www.elprocus.com/wp-content/uploads/2016/05/MQ-%E2%80%93-135-AIR-QUALITY-SENSOR.jpg.
DeleteThank you for your reply, I figured out the confusion! My sensor is attached to a small carbon board that has a pull down resistor inside of it already. The board consists of 4 pins A0, G, D0, and V. The configuration is straight forward, and the measured resistance of the sensor will be taken from the A0 pin using R2 = (Vin/Vout-1)R1, when R1 is 10K potentiometer on the back of my sensor's board and R2 is the resistance of the sensor.
DeleteWell done Shaboopy, good work!
DeleteHI mr.david
ReplyDeletenice article
i want to ask sketch , Can i know sketch gas NH3 mq135 for arduino ?
please
Thanks
Hello and thank you. The sketch could be the same of the CO2, what's change are the a, b factor and Ro value. You can find the a and b factor using the method proposed here in this post, you can even use the Ro proposed here for CO2 but it would be better if you find the NH3 appropriate one using a know amount of NH3 and the method proposed.
DeleteThis comment has been removed by the author.
ReplyDeleteHi Davide, thanks for the super complete explanation on this sensor!
ReplyDeleteI just successfully managed to reproduce your setup using a pre mounted board named FC-22 with the MQ135 on it. The board comes with a pull-down resistor of 1k and some other features for digital reading.
I would like some help regarding my readings. My Raw measurements tend to fall between 36 and 40 on a closed environment. For these values I get between 374ppm and 504ppm. It seems the ppm values vary too much for very small changes on the raw readings and since raw data can range from 0-1023 it's an indicative the precision is not very high. Are my readings close to yours? Is there any way I could try to increase precision with this sensor?
Thanks in advance.
Hello and thank you. Yes, the correlation formulae it's pretty sensitive to slow raw changes, due to the conversion factors. You can make it a little better correlating it to a NDIR sensor, but to me this is not usefull, I mean, this sensor is a eltectro/chemical one, you can use it to get a ~pretty~ accurate values, for more you need to get to NDIR.
DeleteHi Davide, i kinda lost here but how do you know if an air quality is considered as "good" or "bad"? do you know how to measure the range between "bad air", "normal air", "good air", and "dangerous"?
ReplyDeleteHello, you can not consideder "good" or "bad" air just with one sensor of course. But you can take this sensor and consider an evironment not good it CO2 is above 1800ppm as example.
DeleteThis comment has been removed by the author.
Deletehi, i have a question, why ro is 41763, thanks for your answer :) !!
ReplyDeleteHello, please look at my comment in this page June 13, 2017 at 7:51 PM
DeleteHi sir, I am using the mq135 sensor as a smoke detector, is there a simpler way to convert the analog output from the sensor read by arduino to show the present of smoke?? im still quite unsure about the raw reading from arduino, what does the reading represent?
ReplyDeleteHello, the MQ135 is not a smoke sensor. You can use it as a smoke sensor, but something like the MQ2 is preferred. Instead of using the correlation function you can set a thresold on the ADC raw value you read on your Arduino. You can also use an opamp as a comparator, and set the threshold for your smoke detection.
DeleteBuongiorno Davide,
ReplyDeleteI would prefer to write in Italian, but my vocaulary is just not enough :-(.
I was in Milan last time in October and enjoyed the wonderful Panzerotti at Luini´s - I just love them !!!
But now to my question regarding the sensors:
I am trying to make an Ethanol-sensor with a MQ3. My goal is to make vinegar and therefore, if the alcohol content is below 0,3 Vol. I need to add more alcohol so the bacteria can continue working.
The normal working temperature is at about 29°C, so I need to adjust the temperature correction as well.
Do you think it´s possible to use your formula twice in a Sketch ?
So, in the first part, the analog input is read and adjusted by the log-value from the sensitivity table.
This output becomes the input of the second formula, adjusted by the log-value of the temperature table from where I can use it to- for instance - switch some digital pin on or off.
I hope, I could make myself clear enough ?!?
If not, don´t hesitiate to ask.
With kind regards e tanti saluti a Milano,
Jürgen
Hello and un saluto da Milano! As you already post below, i've write a post about temp and humid correlation on MQ sensors here: http://davidegironi.blogspot.it/2017/07/mq-gas-sensor-correlation-function.html.
DeleteHello Davide,
ReplyDeleteI just found out, that you have done it already in another post. I will try and install that in my system.
Grazie mille a tanti saluti,
Jürgen
Ok, here I go again,
ReplyDeleteI tried to put your sketch into the arduino IDE, put the folders adc, dht, mq and uart into the sketch folder (as they are ?!?) but I get a lot of uart errors "undefindes reference.
I checked some of the files and it looked as if they should work on all Arduinos.
did you program it for use with an Uno and do I have to change some pins ?
I do have an Arduino 2560.
Saluti,
Jürgen
Hello, for Arduino you do not need the adc folder and so on, cause that are for plain avrgcc complier. On Arduino i suggest you to use the Arduino framework functions to read resistance https://www.arduino.cc/en/Tutorial/AnalogInput and the a DHT library for external temp and humidity.
DeleteHi mr.david from which the value of pulldown resistor 22000 is obtained ? . thank you
ReplyDeleteHello, you can use the Axel Benz Formula: Rref=sqr(Rmin*Rmax). Rmin and Rmax can be taken by datasheet sensing resistance or making some test. In my case I do an analysis reading CO2 then i chose that resistor.
Deletei have tried the same process....but i was getting a value of 0.789 ppm ...constantly
ReplyDeleteHello, check the resistance of the MQ sensor using e a multimeter, then do the math on Excel, it may be the ADC conversion.
Deletei have got the value for coefficients a and b also minRsRo and maxRsRo but when i try with code and above formula i get wrong value. would you help me sir?
ReplyDeleteHello, you have to find the issue is, so to get the resistance of the sensor, when powered, by using a multimeter, and use excel to resolve with your parameters, then debug the code by using uart output.
Deletethank you sir, i will try it
DeleteBut how to know the amount of gas that I calibrate against sir?
ReplyDeleteand how to get the ppm for each gas I calibrate against if I wanna measure CO2 and NH3 for example with the same MQ135 I'm using?
Hello. You have to calibrate it using a calibrated meter to know the amount if gas. As example for NH3 the calibrated daltonengineering Ammonia meter 43011. For CO2 we almost know the amount of that gas in open air (https://www.co2.earth/). Unluckly that kind of meter are not cheap. But, you can calibrate it against CO2 that's almost free. Then correlate the NH3 function against the CO2 calibrated one. This trick is not really accurate, but form those kind of sensors does the job. Also, please do not make multiple post with the same question over different pages.
DeleteThis comment has been removed by a blog administrator.
ReplyDeleteThis comment has been removed by the author.
ReplyDeleteHi.
ReplyDeletewhy do you use 22k with the datasheet parameters that are corresponding to 20k?
In my case I have a RL of 1k, this because I use the sensor module. Should I recalculate the parameters for my RL? or can I use those from the datasheet ?.
thank you very much
Hello, read my comment here: April 30, 2018 at 10:02 AM.
DeleteIt could helps.
Hi sir, the R-Fiddle tht you upload no longer can be used.
ReplyDeleteHello, you can find the link of r-fiddle on their page, or you can download R. Anyway the old version should be available here http://old.r-fiddle.org
DeleteThis comment has been removed by the author.
ReplyDeleteHi sir,in step to read the value of resitance when the co value at certain ppm is already entered in calculation step like arduino code above or just reading ppm value like analog sensor in general?
ReplyDeleteYou can read the ADC and resistance like other sensor.
DeleteHi, Its impossible to run r-script now via online compilers I cant read r language can you advice how to run your r script ?
ReplyDeletebefore I was using it via 1 online compiler and it was working great but now some functions it cannot find then is complaining about something else.
Thanks
Hello, take a look there: https://github.com/datacamp/datacamp-light
DeleteDavide,
ReplyDeleteI have a MQ136 and it is attached to a board. I take it the blue dial controls the resistance. Is there a way to use a meter to measure the resistance of that dial? I’ll attempt to find the a and b values as you instructed, but I’m not sure where this dial fits in, even if I could read it.
Hello, it depends on the board. You have to trace it out to undestand this.
DeleteThis comment has been removed by a blog administrator.
ReplyDeleteThis comment has been removed by a blog administrator.
ReplyDeleteThis comment has been removed by a blog administrator.
ReplyDeleteWhat is load resistance of mq2 sensor module ?how it measure
ReplyDeleteHello, you can measure the resitence of the sensor using a multimeter, between pin A and B.
DeleteHai, can you help me with mq131 ozone sensor gas?
ReplyDeleteHello, unluckly I've not a lot of time for that, but you can find a lot of information on my blogpost and comments below. You can find correlations values using the method provided here.
DeleteBuonasera Sig. Gironi,
ReplyDeletevedo che è molto esperto gentile e disponibile, pertanto chiederei un suo aiuto in merito al sensore MQ135 che sto usando su Raspberry.
Vorrei ottenere un risultato in ppm per quanto riguarda il Benzene.
Non essendo informatico ho utilizzato questa guida https://tutorials-raspberrypi.com/configure-and-read-out-the-raspberry-pi-gas-sensor-mq-x/
che mi restituisce valori che vanno da 0,005 a 0,02 in ambiente "normale", ma non riesco bene a interpretarli.
Secondo la sua esperienza le sembrano congrui? ha dei parametri di confronto? il valore restituito si tratta effettivamente di ppm o di altro valore che va inserito all'interno di una funzione?
la ringrazio in anticipo della disponibilità
un saluto
Buonasera, prima di tutto deve trovare i coefficienti a e b della formula che trova in questo post, utilizzando la regressione di potenza sul grafico di correlazione ppm Rs/Ro del datasheet del sensore in suo possesso. Per farlo può utilizzare il metodo spiegato in questo post. Successivamente con questi valori può leggere la resistenza del sensore, inizialmente con un multimetro, e poi utilizzare il valore letto per validare i coefficienti trovati. Come può vedere dal grafico, il sensore MQ135 rileva benzene (C6H6) da 10ppm a 200ppm circa. Sotto i 10ppm è fuori specifica datasheet, potrebbe leggere un valore, ma rimane comunque fuori dalle specifiche. Cordiali saluti.
DeleteThis comment has been removed by the author.
ReplyDeleteHello I have just tried using your code at the bottom of the vlog for the arduino, it seems to work fine. I can not get the R-code to work to obtain my own values for a,b,Ro etc, so I used your values from your video. but only issue is that My PPM values are very low at ambient conditions, around 10ppm when I would expect around 400ppm, Are you able to advise at all? I have included the code I used below
ReplyDelete#include
LiquidCrystal_I2C lcd(0x27, 2, 1, 0, 4, 5, 6, 7, 3, POSITIVE);
//sensor input PIN
int mqInput = A0;
//pull-down resistor value
int mqR = 26954;
//rO sensor value
long rO = 42858.58;
//min value for Rs/Ro
float minRsRo = 0.4470333;
//max value for Rs/Ro
float maxRsRo = 2.395153;
//sensor a coefficient value
float a = 109.8257;
//sensor b coefficient value
float b = -2.743509;
void setup() {
pinMode(mqInput, INPUT);
Serial.begin(9600);
// init pin for LCD display
lcd.begin(20, 4);
}
void loop() {
int adcRaw = analogRead(mqInput);
//PPM Calculations
long rS = ((1024.0 * mqR) / adcRaw) - mqR;
float rSrO = (float)rS / (float)rO;
float ppm = a * pow((float)rS / (float)rO, b);
//Display Print outs
Serial.print("Rs: ");
Serial.println(rS);
lcd.setCursor(0,1);
lcd.print("RS= ");
lcd.print(rS);
Serial.print("Rs/Ro: ");
Serial.println(rSrO);
Serial.println(rSrO);
lcd.setCursor(0,2);
lcd.print("RSRO= ");
lcd.print(rO);
if(rSrO < maxRsRo && rSrO > minRsRo) {
Serial.print("ppm: ");
Serial.println(ppm);
lcd.setCursor(0,0);
lcd.print("PPM= ");
lcd.print(ppm);
} else {
Serial.println("Out of range.");
}
delay(1000);
}
Hello Jamie, at first i will check the resistance of the sensor, reading it with a multimeter. Then double check if your code is converting it to a valid resistance value.
DeleteOK, will be checking the resistance once I get hold of a multimeter. I am also struggling to find a way to run your R-code. How would you recommend? as R-fiddle doesn't work anymore. I did look at the github link that you recommended to someone else, but when I open the github page I don't know what to do from there...
DeleteHello, you can download R, or you can use the github link recomended in the r-fiddle page, or use the old version here: http://old.r-fiddle.org/#/
DeleteThis comment has been removed by the author.
ReplyDeleteHow can one identify gas? I posit that one finds each gas difference from read value to reference value (as plotted). This assumes only one gas leak at a time. Relative SD is meaned for each gas*sensor, lowest is gas, mean the ppm of in range sensors per eqn ..
ReplyDeleteSound legit?
Please do not double post the same questions, look at my anwser at October 2, 2020 at 11:07 AM https://davidegironi.blogspot.com/2017/08/mq-gas-sensor-correlation-coefficients.html
DeleteHello,
ReplyDeleteFirst I am a beginner for programming.
I have to use MQ7 sensor with AVR Atmega32 microcontroller and have code it using c programming language in my first year project. So when I search MQ7 sensor codes I can only seen this sensor working with Arduino. But I cannot use Arduino in my project. So can Mq7 sensor work with atmega32 microcontroller? And can I change and use this code for MQ7 sensor in atmega32?
Hello, yes it works with at ATmega32. The code behind this library is really simple, it's just a function that convert the reading from ADC to a PPM value. The trick is only to calibrate the values.
DeleteThank you very much for quick answering.
Delete