One of my small but very useful DIY projects was modifying a standard 230V power strip so it automatically turns on and off together with my PC. The goal was simple: power my 2.1 audio system only when the computer is actually on, without having to manually flip a switch every time.
I started with a normal 230V power strip equipped with a mechanical on/off switch. After disassembling it, I removed the original switch entirely. Instead of replacing it with a relay PCB board.
In place of the original switch, I installed a custom PCB with a 5V relay. The relay is wired so it switches the mains line exactly like the original power switch did, but now it’s controlled by a low-voltage signal.
To power the relay, I connected it to a 5V USB cable. This way, when the PC provides 5V, the relay closes and the power strip turns on. Simple and effective.
I realized a limitation of my PC, unfortunately, the USB ports on my motherboard remain powered even when the PC is turned off. This meant the power strip stayed on all the time, defeating the whole purpose. Some BIOS setups allow disabling USB power when the PC is off, but in my case, that option simply wasn’t available.
To fix this, I redesigned the activation method. Instead of relying on USB power, I created a custom adapter from an internal PC power supply connector to a 2.5mm DC power jack mounted on the back of the power strip.
Now the relay gets its 5V directly from the PC’s internal power supply, meaning it only receives power when the PC is actually on. When the PC shuts down, the relay releases and the entire power strip turns off automatically.
In this post I’ll present a purpose-built adapter board for the SCT-013 series current transformer: through-hole PCB, configurable burden resistor to match the specific version of the SCT-013, and a conditioned output suitable for a microcontroller input.
For the detailed logic of how the SCT-013 works in conjunction with a microcontroller, see my previous blog: https://davidegironi.blogspot.com/2016/12/ct-sensor-on-avr-atmega.html
The SCT-013 (and similar split-core current transformers) provide a safe and convenient way to monitor alternating current without cutting the conductor. However, to interface this type of CT properly to a microcontroller ADC input you need to handle a connect a few components.
An adapter board simplifies the mount of the SCT-013 (via its connector or wires) and you populate the correct resistor/burden resistor footprint, then provide a clean output to your microcontroller.
Last month I've found a big industrial enclosure with a giant knob on it throwed away. I've take it home and open it. To my surprise what's inside was a variac.
A variac is a type of variable autotransformer in which the output voltage is varied by twisting a dial.
My variac is the Belotti V-10NA 220V 900VA 4A.
WARNING! - The project described in these pages utilizes POTENTIALLY FATAL HIGH VOLTAGES. Do not attempt to build circuits presented on this site if you do not have the required experience and skills to work with such voltages. I assume no responsibility whatsoever for any damage caused by the usage of my circuits.
In my small home lab I don't have a variac, so I decide to clean it and prepare a new enclosure. The original enclosure was big, and it has disconnected wires. It was all a wiring jam.
I throw almost all and keep the variac. I clean it and then I select an enclosure that I've around.
I decide to built it using a simple circuit.
It has two fuses, one on the mains input rated 6.3A on the rear side. The other on the front side. This last one is useful if someone want's to test some equipment.
Then I have a main switch. I've around a 25A one. And a de-activate switch, a 16A switch that I use to de-activate the output, when activated a bulb lights up.
The main switch powers the variac, and the two meters I've put. There is one voltmeter that measure the mains line. The other measure the output from the variac. It also features an ammeter. This last one is a cheap two wires meter, for this reason it takes supply from the line and it can not measure voltage lower than 20V. If I want accurate measurements or lower voltage measure I can wire my multimeter on the line output.
It's important not to overtake the limit of 900VA output, otherwise the variac will became hot and eventually burn his coils.
On the output I've put an EU plug, and a couple of banana plug in parallel,
The enclosure I've around it's used so I've to clean it and cut holes. The front panel already has holes, so I've to put a piece of wood in front of it to keep the front clean.
The finish product is pretty good at my eyes, and finally my lab also have a variac.
MicroProto is a mini protocol for data exchange between devices.
It is build and tested over the serial communication protocol, but it can be ported to others.
It is designed to send strings and byte arrays.
MicroProto is a variable length, in the current implementation you can send up to 999 commands, and 999 byte long byte array.
The command structure is the following: STX|ACK|NAK DATA CRC ETX
Command parts are:
STX (hex 0x02): command begin
ACK (hex 0x06): acknowledgment command begin
NAK (hex: 0x15): negative acknowledgment command begin
DATA: byte array
CRC: 1 byte CRC code
ETX (hex 0x03): command end
Send command can request an acknowledgment to be sent back. The acknowledgment command must start with ACK or NAK byte.
The ESC special char (hex: 0x1B) is used as escape character. Indeed if a ETX byte is sent in DATA, it is preceded by the ESC character.
Each command must have a CRC hex byte, this prevents communications errors.
CRC function is CRC polynomial x^8 + x^7 + x^2 +1 implemented using a lookup table to speed up the computation process.
Errors in communications may happens, due to timing or interference. However I'm using this protocol with decent results.
Embedded side, there are two ways this protocol process input data: "blocking" and "timed".
The blocking way try to read input from the selected channel, that is UART in this example. If a char is read, then the next one is processed, till the the end of protocol command, or till the threshold wait time passed.
In the timed way, two function are involved, one that read characters, and another that can be called to get the last command found. Most of the works is done inside the read/input function. This function read one, or up to a threshold bytes until the end of protocol command.
On both function a few other error preventing mechanism are implemented.
The timed functions most of the time it's the way to go, cause it does not stop the working loop that much. One can even put this function in a TIMER, and use the read last command function in the program loop.
There are a few parameters that can be set inside the header files, above all involve timing.
Send/Get character functions are passed as parameters during initialization, this makes this library portable to a few microcontrollers, and also to other than USART bus.
Indeed this library is been tested on
AVR ATmega/ATtiny
ESP8266
ESP32
Arduino Framework
STM32 family with HAL framework
A NET C# client library is implemented for test, you can use this library as a starting point to write your own client library or use the code straight in you .NET project.
I've a found a plotter. The VP600 Basic by Brady is a X-Y pen plotter for tag.
Of course there's some part broken and missing.
The pen holder and the power supply are missing, the plotter has a dent on one side, software is missing and also I'm not sure electronic is working.
I disassembly it, repair the dent and check that the X-Y mechanism is working.
It has a small piece of plastic of the X axis broken, so I've to glue it. Apart from this, the hardware is working, at least what I can check without connecting it.
Because the missing parts I've decided to convert it to something else, something I don't still have. So a vinyl cutter.
First step is to build the electronic board. An Arduino Pro Mini with a ATmega328 can work for me.
The firmware I've selected it's grbl (https://github.com/grbl/grbl), but I've to compile a version that works with a servo as Z-axis, cause my holder will be based on a servo.
The pcb is simple, the grbl docs page contains all the information about wiring. I've to wire two stepper motor driver board, A4988 based, and just a straight wire for the servo conroller, which will be a mini RC servo.
I've assemble the PCB under the original PCB, reusing the USB and power plugs. That way I can use the original case holes for connections.
The motor of the plotter are 4 wires, just follow the grbl guidelines to wire it. Find the correct wiring diagram is just a matter of finding the stepper motor coild using a multimeter reading resistance between wires.
I've covered the plate of the plotter with a plastic 4mm sheet, this will prevent the cutter blade to break on the original alluminum base.
Then I've to set the step steps/mm for each motor. There are plenity of pages teaching how to do this, so it's just a matter of reading and applying the procedure.
In my specific case I've set
$100 80.240
$101 80.240
Also I've to set in G-Code Generation tab of the GRBL plotter the Pen up / down translation to PWM, then set the PWM op Pen Up function to 1000 and Pen Down to 0.
One the plotter is set I've to select the proper spring for the holder. The holder spring defines the cut strength.
I've made some test. What I've found is that cutting vinyl is not so simple, the most difficult thing is to find the right cut spring. At the end of the day the cutting quality is acceptable to me. Not as accurate as a pro machine, but as much as I need, and also I've saved a plotter from the junk.
My parents has to change their doorbell. They have one 90's audio only doorbell with multiwire connection.
We buy a new video doorbell. It's the Vimar K40910 Kit. This doorbell cames in two parts: the external unit and the internal monitor unit.
30 years later the intercom of my parents, devices talks using a on a two wire protocol, that is fairly better from the installation point of view, but worst in terms of extentions.
I would like to add a couple of additional buzzer. This new intercom does not have any connection for additional speaker ring. It's time to find a way to add this output.
The ring I would like to add are simple 12V buzzers. I basically need to close a switch for a certain amount of time whenever the doorbell button is pressed.
First try was to reverse engineer the two wire protocol. It happens to be a 24V two wire DC protocol, with modulation on high frequency. My 50Mhz scope could barely catch the modulation. That means I would have to get it using an FPGA or a micro with a decent speed. I try to make thinkgs simple, so my Plan B take action.
On the external unit the button is connected to a 5V and a GND route. I suppose the 5V is a pullup connection to the unit microcontroller.
First try was to use this pullup voltage to engage the led of an opto-coupler. I fail. That's because the voltage drop across the led also drop the voltage under the threshold for the microcontroller of the external unit.
So I decide to use a comparator. I find a 12V line from the external unit. I use the 12V to drive an op-amp (LM358) in comparator mode, comparing GND with the pullup line. Then the signal is inverted using a NPN transistor (2N3904). I use this signal to drive an opto-coupler (PC817).
On the other side of the opto-coupler I have to put the timer circuit. Cause I want the rings to emit sound for a certain time after the unit button is pressed. I've used a common NE555 timer circuit. I've just to select the right resistor and cap to obtain a timer from less than 1 to more than 30 sec.
The buzzer are driven by a N-Channel Mosfet with the gate connected to the NE555 output.
This small circuit is now ready to be soldered on protoboard. It fits the enclosure of the external unit mounting, the 12V that drive the buzzer are taken from an additional power supply and I can use the multiwire cable that was previously connected to the old intercom.
Hall Sensor are pretty common components. Most of the time one will find 3 pin Hall Sensor. But there are time that one can find a 4 pin hall sensor.
Those kind of sensor is called dual-channel.
They basically have GND and VCC input, then two output. When a magnetic field is applied a small voltage happears between the two output, reversing the direction of the applied field will reverse the voltage output.
If you want to use that sensor as a switch you have to build a comparator circuit that ouput a signal level.
As example, in old cdrom brushless motor those kind of hall sensor are common. To use an old cdrom as a rotary encoder, or to connect the cdrom to a brushless sensored driver, you need to convert the output of the 3 hall senso monted on the cdrom in a logic signal output.
The circuit proposed here use a differential comparator to achieve this goal.
Here you can find the schematic and a board design for this circuit, in Eagle format.
In the post linked above I've discuss a method to correlate the sensor resistance to a gas ppm using the datasheet curve named "sensitivity characteristics of the MQ-135" and the formula: ppm=a*(Rs/Ro)^b.
Someone ask me about sensor and correlation coefficients of various gasses, so here I will post some correlation coefficient for the a few MQ sensor and gasses.
sensor
gas
a
b
min Rs/Ro
max Rs/Ro
MQ2
LPG
591.283
-2.076502
0.256166
1.68543
MQ3
alcohol
0.3923202
-1.493249
0.1143375
2.497754
MQ4
CH4
1041.333
-2.729007
0.4365277
1.830508
MQ5
CH4
217.4972
-2.422111
0.2058715
1.035233
MQ6
LPG
940.2178
-2.521573
0.3915661
1.847477
MQ7
H2
64.86522
-1.405261
0.05323301
1.203488
MQ8
H2
1079.683
-0.6416874
0.03115283
13.84067
MQ135
CO2
110.3794
-2.721706
0.8038119
2.416431
Those values have been found using the method proposed in the above post, and the figures posted below.
In order to use the correlation function, you now need to compute the Ro value. You can find this value reading the sensor resistance at a know amount of ppm, compy in the gases ppm limits of the datasheet, and then use this formula: Ro=Rs*(a/ppm)^(1/b).
As I said those sensor are electro-chemical. Accuracy of those sensor is not the best. Also they will react to many gases. It means that if you are trying to measure the ppm of a certain gas with this sensor, you will have false measurement values if any of the other gas that the sensor react to, changes.
Here I will "overengeneer" on this type of sensor, trying to correlate the MQ sensor readings to temperature and humidity too, even if this correlation to me is not prominent. The correlation formula I've found may be wrong, so let me know if there is something to fix here.
As the previous post, let's consider the MQ-135 sensor as reference, find below the "sensitivity characteristics of the MQ-135" figure of the datasheet we used to obtain ppm from resistance redings.
The MQ sensor datasheet also comes with a "typical dependence curve of the sensor on temperature and humidity" let's call it dependance curve.
It shows us how the Rs/Ro change against temperature and humidity.
What we are searching here, it's a way to relate the sensitivity characteristics curve with the temperature and humidity dependance curve.
It means, a way to find out ppm, reading the sensor resistance at any given temperature and humidity.
Before going ahead.
Notice that the sensitivity characteristics curve, from which we have found the correlation function ppm=a*(Rs/Ro)^b coefficients a and b, it's acquired under certain circumstances, as example for the MQ-135 sensor 20C temperature, 65% humidity, O2 21%, Rl 20k, Ro at 100ppm of NH3 in the clean air.
The dependance curve of the sensor also it's acquired under certain circumstances, as example for the MQ-135 sensor Rs at 100ppm of NH3, Ro at 100ppm of NH3 in air at 33%RH and 20C.
At first we have to ask if we can relate sensitivity characteristics curve to dependance curve of the sensor?
Each curve it's taken under different circumstances, the first has both Rs and Ro acquired at 20C temperature, 65% humidity, the second one has Ro acquired at 20C temperature, 33% humidity. Both ratio related to a Ro at 100ppm of NH3.
The Ro of the sensitivity characteristics curve it's taken at Ro at 100ppm of NH3 in clean air, just as the Ro of the dependance curve, only temperature and humidity differs. Obviously it means that the sensor resistance at 100ppm of NH3 Rs it's just Ro, at any temperature and humidity,
This does not means that the sensitivity characteristics curve it's valid under any temperature and humidity, notice that the dependance curve may differs under different gas concentration, or different gas. We just know it's acquired for 100ppm of NH3, but we do not know what's the dependance curve at other gas concentration. Also the sensitivity characteristics curve may differs under different circumnstances of temperature and humidity.
If we suppose that the dependance curve it's linear over different gases and concentration, we may relate the ratio of the sensitivity characteristics curve to dependance curve.
We get the a and b coefficients for the correlation function ppm=a*(Rs/Ro)^b from the sensitivity characteristics curve.
To estimate the Ro, we read the sensor resistance at temperature T1 and humidity H1 (Rs_T1CH1%) given a know amount of gas to estimate. We are trying to estimate Ro at 100ppm of NH3, at temperature 20C and humidity 65% (Ro_20C65%).
Ro_20C65%=Rs_T1CH1%*(a/ppm)^(1/b)
Because the sensitivity characteristics curve it's acquired 20C and 65%, we need to correlate Rs_T1CH1% to Rs_20C65%. We can do this, because we have assumed that the dependance curve it's linear over different gas amount.
Defined Ro at 100ppm of NH3 20C and 33% as Ro_20C33%, by the dependance curve
Rs_T1CH1% / Ro_20C33% = m
and
Rs_20C65% / Ro_20C33% = n
so
Rs_20C65% = (n / m)*Rs_T1CH1%
and
Ro_20C65%=(n / m)*Rs_T1CH1%*(a/ppm)^(1/b)
Now conditions changed, we are at temperature T2 C and humidity H2 % (Rs_T2CH2%).
So hour function is not yet valid
ppm=a*(Rs_T2CH2%/Rs_20C65%)^b
for this function to be validated, we need the to correlate Rs at temperature T2 C and humidity H2 % (Rs_T2CH2%) to temperature 20C and humidity 65% (Rs_20C65%).
As we does for the previos correlation
Rs_T2CH2% / Ro_20C33% = t
and
Rs_20C65% / Ro_20C33% = q
so
Rs_20C65% = (q / t)*Rs_T1CH1%
and
ppm=a*((q*Rs_T1CH1%)/(t * Rs_20C65%))^b
To find out the correlation factor between this ratio, the simpler thing here, is to build up two lookup tables, one for each of the curves showed.
On the MQ-135 we will get a lookup table for 85%RH and one for 33%TH curve.
We can do this by using a tool like WebPlotDigitalizer.
Now, we have two lookup table, for two different humidity values. Each of the points of that lookup tables represent the Rs/Ro against a certain temperature.
As example, suppose we have read Rs at 22C, 50%
Rs_22C50%/Ro_20C33% will be the interpolation between Rs_22C33%/Ro_20C33% and Rs_22C85%/Ro_20C33%.
Rs_22C33%/Ro_20C33% = RsRo_20C33% + (22C - 20C)*(RsRo_30C33% - RsRo_20C33%)/(30C-20C)
Rs_22C85%/Ro_20C33% = RsRo_20C85% + (22C - 20C)*(RsRo_30C85% - RsRo_20C85%)/(30C-20C)
Rs_22C50%/Ro_20C33% = RsRo_22C33% + (50% - 33%)*(RsRo_22C85% - RsRo_22C33%)/(85%-33%)
At the end it's just a matter of linear interpolation, to find out m and n values to estimate Ro at 100ppm NH2 temperature 20C and 65% humidity, and t and q values to estimate Rs at temperature 20C and 65% humidity.
All have been implemented and tested using an ATmega8.
The underlying chart shows the CO2 ppm correlation.
Time is reported on the x-axis, CO2 ppm values on the left y-axis, humidiy and temperature values on the right y-axis.
The MQ135 resistance reading are then translated to ppm with and without the temperature / humidity correlation method (green lines).
A reference NDIR sensor shows us an accurate CO2 reading.
As you can see the CO2 temperature/humidity correlation function works slightly better than the uncorrelated one.
Tests are repeated 3 times per sensor, using 3 MQ135 sensors.
The code below implements the resistance to ppm corrleation functions, and also the temperature and humidity correlation functions, as the main correlation function mq_getppmtemphumd.
The MQ series are cheap gas sensors.
They are resistive electro-chemical sensors.
These sensors have a heating element and a resistance that react to gases.
Below a MQ135 sensor opened. Inside it looks like that.
To read the sensor's resistance, we measure the voltage drop of the sensor.
The method we use to measure resistance on the micro is by using the ADC, and a pull-up (or pull-down) resistor. Here http://electronics.stackexchange.com/a/70012 you can find a good explanation on the pull-down/up method on reading resistance.
In this post I will explain a simple (to me) method of obtaining correlation function for any MQ series sensors that fit an exponential function.
An italian version of this article has been published in the may number of Elettronica In (http://www.elettronicain.it/) magazine.
As a reference, let's consider the MQ135 sensor (again).
We will look at the "sensitivity characteristics of the MQ-135" figure of the datasheet.
Notice that it's a log-log plot, this means that is has logarithmic scales on both axes.
Another thing to notice, is that the y-axis is for Rs/Ro, it will be much clearer if we impose ppm on the y-axis.
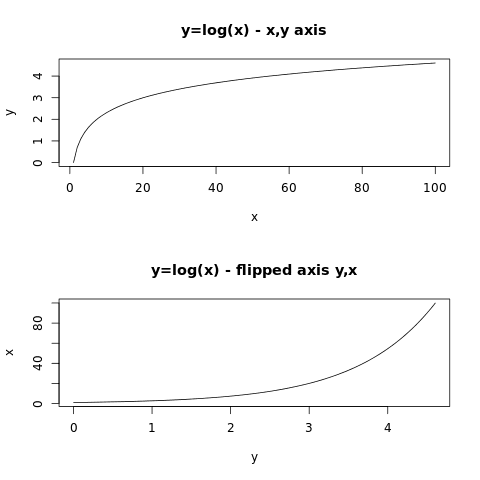
So as a first step, we will flip the axis.
As a reference, above we will see a flip axis example
Now, let's take a look at a power function with different exponents.
Let's try to plot those function on a log-log scale.
You may notice that an exponential function flipped is again an exponential function, with different coefficient of course.
As you may see, the power function with a negative exponent looks like the one we are searching for.
Summarizing, let's take the power function y=x^-2 and plot this on the log-log scale, with a 10 multiplier
We are searching for something like:
y=a*x^b
with b<0
Now, our purpose is to find out the value of the a and b constants, starting from the datasheet figure.
We can do this by performing a nonlinear regression. Specifically we need a power regression.
First, we need to collect values from the datasheet figure. WebPlotDigitizer is the tool we are going to use here: https://github.com/ankitrohatgi/WebPlotDigitizer. We can find few online tutorials that teach us how to use WePlotDigitalizer. I will try here to sum it up here:
1) extract the figure from the datasheet
2) load the figure on WebPlotDigitalizer
3) set axis, remember to se axis both as log
4) check out points from the curve of the gas you need to found
5) click on the view data button, and you get the points you need.
Now that we have found out the points of the curve from the datasheet, we need something to load with those points and perform a power regression.
You can use matlab or you favorite math software tools. There are also other online tools you can use to perform power regressions. Here I will use an R (ref. https://en.wikipedia.org/wiki/R_(programming_language)) script I've write.
You just have to load the points values you have found out, and launch this R script. You can also launch it on http://www.r-fiddle.org/.
The script will find out the function coefficients (a and b), and print out the function found next to the graph points, just to check the function's accuracy.
Below the Rs/Ro vs ppm function, as seen on the datasheet.
Then the flipped function we are searching for
Then, the plot of both functions on linear scale axes:
Now we have to estimate the Ro coefficient.
Ro estimation is quite simple
We just need to solve this equation for Ro
ppm=a*(Rs/Ro)^b
Ro=Rs* sqrt(a/ppm,b)=Rs*(a/ppm)^(1/b)
note: in my library here: http://davidegironi.blogspot.it/2014/01/cheap-co2-meter-using-mq135-sensor-with.html i simply Ro as Rs*sqrt(a/ppm,b) = Rs*exp(ln(a/ppm)/b), which is the same that Rs*(a/ppm)^b.
So given the function coefficients, we have to measure the resistance of the sensor at a know amount of ppm for the gas we are investigating.
Now, just substitute the found function coefficients (a and b), the resisteance we have read (Rs in ohm) at the amount of gas (ppm) to the estimation Ro function
Ro=Rs*(a/ppm)^b
One last step is to provide the Rs/Ro limits we are going to use to validate the input for our solving function ppm=a*(Rs/Ro)^b
We know that Rs/Ro=(ppm/a)^(1/b)
So
min[Rs/Ro]=(max[ppm]/a)^(1/b)
max[Rs/Ro]=(min[ppm]/a)^(1/b)
By the datasheet figure we have to select the max and min Rs/Ro and ppm points.
Notice that we get the max Rs/Ro value for the min ppm point value.
Here you can find the R script to estimate correlation function coefficients, compute Ro, min and max Rs/Ro (input: x/y axis limits, correlation function points, resistance of the sensor in ohm at a know amount of gas in ppm).
On gist: https://gist.github.com/davidegironi/b7be6b7cace6b475dd42c48c3e62fcf4
Above an implementation of the raw value to ppm conversion, sample sketch for Arduino:
//sensor input PIN
int mqInput = A1;
//pull-down resistor value
int mqR = 22000;
//rO sensor value
long rO = 41763;
//min value for Rs/Ro
float minRsRo = 0.358;
//max value for Rs/Ro
float maxRsRo = 2.428;
//sensor a coefficient value
float a = 116.6020682;
//sensor b coefficient value
float b = -2.769034857;

void setup() {
  pinMode(mqInput, INPUT);
  Serial.begin(9600);
}

void loop() {
  int adcRaw = analogRead(mqInput);
  long rS = ((1024.0 * mqR) / adcRaw) - mqR;
  Serial.print("Rs: ");
  Serial.println(rS);
  float rSrO = (float)rS / (float)rO;
  Serial.print("Rs/Ro: ");
  Serial.println(rSrO);
  if(rSrO < maxRsRo && rSrO > minRsRo) {
 float ppm = a * pow((float)rS / (float)rO, b);
 Serial.print("ppm: ");
 Serial.println(ppm);
  } else {
 Serial.println("Out of range.");
  }
  delay(1000);
}
This "Get Ready For Win98" Laser Engraving Machine it's built using an old scanner, and an old printer.
A laser engraving machine is a tool that uses lasers to engrave an object.
Before starting up, read my blog disclaimer and the one below:
Warning! Laser diodes drive are emitting visible and invisible laser radiation and they are extremely dangerous! Their light can permanently damage the eyes. You must never look into the working diode even without the lens or point it on a reflective surface. Laser beam can cause burns or fire. This is usually a Class IIIb laser. Everything you do at your own risk.
The Y-axis it is build using the scanner assembly, the X-axis using the printer one.
As you can see by the Get Ready For Win98 sticker, the scanner is pretty old, and this sticker was so vintage that i've decided to leave it on.
The base of this machine is the scanner itself.
The scanner was completely disassebled, all except the motor and the movement mechanism is removed. The same applies for the printer.
Assembling the hardware, pay attention to build it making X normal to the Y axis. The two direction has to be perpendicular, or your engraving will have distortions.
The printer mechanism it is connected to the Y-axis scanner assembly, that way, the laser moves over the part to be engraved.
My engraver it is powered by a 12V 2A power supply, though the total current absorbed it's 700mA.
The brain of this project is an ATmega328p running at 16Mhz. loaded with grbl firmware http://github.com/grbl/grbl, which is a powerfull yet opensource g-code parser.
I've used an Arduino Mini board, even if the software does not use the Arduino framework.
A 7805 voltage regulator it is used as power supply for the ATmega.
Grbl 0.9 it is build for 3 axis router, to make it works on 2 axis systems like this, with hard limit and homing enabled, a custom version of the firmware it is needed. The only change to apply to version 0.9g are on config.h file.
lines #define HOMING_CYCLE_0 (1<<Z_AXIS) #define HOMING_CYCLE_1 ((1<<X_AXIS)|(1<<Y_AXIS))
was commented out and changed to: #define HOMING_CYCLE_0 ((1<<X_AXIS)|(1<<Y_AXIS)) //#define HOMING_CYCLE_0 (1<<Z_AXIS) //#define HOMING_CYCLE_1 ((1<<X_AXIS)|(1<<Y_AXIS))
Then the new grbl firmware can be compiled and used, preventing grbl 0.9 homing problem on 2 axis machines.
My custom version of grbl v0.9g compiler for ATmega328p @16Mhz, with a baudrate of 115200, can be download below.
CP2102 it is used as USB to UART board.
You just have to upload the firmware using your favorite uploader, the grbl wiki page drive you on how to do this step.
On the grbl wiki page you could also find any other information about command and software setup.
The motor driver I've use to move the X and Y motor stepper are Polulu A4988 Stepper Motor Driver Carrier, based on Allegro A4988.
My scanner has an unipolar 5-wire stepper motor. That Allegro driver works only with 4-wire bipolar stepper motor. So I've transformed the unipolar motor to a bipolar stepper motor.
To made this modification, I've just cut the common wire between the two main windings. Then I checked that the windings haven't got any connection by using a multimeter. That way i have two coil, like a bipolar motor. Look at the image below for carify:
The printer has a bipolar 4-wire stepper motor.
We can setup how many microstep and how much current Allegro A4988 sends to the motor.
Incrasing microsteps makes the motor more accurate, but it also reduce the motor torque.
You can made some tests to find your best motor power setup.
For mine motors, to allow a smooth and fine motor movement, and a good torque the Allegro A4988 it is setup to 8 microsteps for the Y-motor, and 16-microstep for the X-motor.
Below you can find the basic Polulu board connection wiring.
To make the Polulu board runs at 8 microsteps M1 and M2 has to be connected to logic power supply VDD, if you want to run it at 16 microsteps, connect also M3 to VDD.
Motors supply VMOD is connected straight to 12v.
On each axis a limit and an home microswitch it is placed to prevent axis over-running, and eventually the motor or the motor driver damage.
Because the limit switch are pretty sensible to noise, I've added an high pass 100nF capacitor and an additional pull-up 10k resistor. Also the limit and home wire are indipendent and distant from the motor and laser cable strap.
The laser used is a red laser diode, taken apart from the DVD-ROM writer optics.
In CD-ROM and DVD-ROM you could also find IR driver, DVD laser writer diode will be a little more powerfull than the CD one.
Laser diode usually has three pins, one is the common ground, laser and photodiode cathode (-), one the laser diode anode (+), the other is the monitor photodiode anode(+).
If the diode you are using has no mark, and you do not know the diode pinout, you have to find the laser cathode and anode. One simple method I use is to power up the diode with a 1.8 to 2.2v current, just for a little amount of time, let's say 1s, if it absorbs current, that wiring is the laser diode pinout.
Laser diode has to be drive with a proper driver, to run mine, i've build a LM317 based laser driver.
This laser driver can drive diode from 12mW to 700mW.
A 9v voltage regulator prevent overvoltage on the laser diode.
Also a NPN it is placed to allow the TTL input that comes from the microcontroller to enable or disable the laser.
We are using LM317 IC as a current regulator.
Input voltage get in the Vin pin of the LM317, from the output Vout to the ADJ pin there is a resistor R connected.
The output current Iout is given by the formula Iout = Vref/R.
Over there resistor there always be Vref voltage. When current decrease, the voltage over R should be lower, but that way the regulator increase his output voltage to adjust his Vref voltage.
Vref is 1.25 for the LM317. R is made using a fixed resistor R1 and a trimmer R2. That resistor and the trimmer sets the current that the laser use.
So laser driver current is given by the formula: I=1.25/(R1+R3).
The power rating of the resistors R1 and R2 is calculated by the forumla P=1.25*I.
Before connecting the laser and testing the driver, check that the resistence is the higher value possible, then connect the laser and measure the absorbed current using an amperometer. Note that if you set too much current to the laser, that will blow.
Below the laser driver circuit.
A standard 60mm x 60mm pc brushless fan is installed to clear the smoke, this prevents the laser optics lens to be clouded.
Commands to the engraving machine are sent through UART at 115200 baud rate.
One you have built the machine, checked and connect all, upload the grbl firmware to your microcontroller, you could use terminal software, or a grbl controller to setup your board. I'm using Universal G-Code Sender to setup and send command to grbl, but you can also use a simple terminal.
The first thing to do is test the motor movement:
To test it, just send the X10 Y10
command, or use the Universal G-Code Sender movement button.
You should see a motor movement on each axis.
Also check the laser is turned on and off using M3
and M5
command.
Now to setup the correct motor distance to run, you have to set each motor step/mm.
The axis motor step/mm calibration method is pretty simple.
Let's try the X axis calibration as example.
We know how many step/mm or steps_per_revolution grbl is actually setup, grbl $100=250.000 (x, step/mm) parameter.
Now, we move your motor for some steps, let's say 100 microsteps, the axis should have move 100mm.
Now we measure the real distance the motor has moved, let's suppose is 181mm.
The new step/mm value for this motor axis should be steps_per_mm = (steps_per_revolution*microsteps)/mm_per_rev
so 138.121 = (250*100)/181 $100=138.121
Now, if you move the motor 100mm, it should move 100mm.
Because i've installed the limit and home switch, I have alse enabled hard limits $21=1
I've setup the homing pull-off to 5mm, cause my microswitch have a long lever, and i want the motor to move fare away after the home cycle. $27=5.000
Also the homing cycle it was enabled: $22=1
And the homing direction mask it is changed. One may even need to invert axis direction, "dir port invert mask" is the paramenter you have to touch.
Those are the most common grbl setup, for the complete list, look at the grbl wiki page. Below you can find the grbl configuration parameters i changed: $21=1 (hard limits, bool) $22=1 (homing cycle, bool) $27=5.000 (homing pull-off, mm) $23=3 (homing dir invert mask:00000011) $100=37.879 (x, step/mm) $101=94.246 (y, step/mm) $110=100.000 (x max rate, mm/min) $111=100.000 (y max rate, mm/min) $130=212.500 (x max travel, mm) $131=274.400 (y max travel, mm)
Now you could be able to send g-code drawing to your engraver.
There are a lot of software you could use to build g-code draw, the one I use the InkScape.
The working are for this plotter is 212mm x 274mm, so setup your project area to this dimension.
Once you have you path, then you could select the path you want to engrave, and transform it using the InkScape laser engraver extension.
Just copy the extension on your extension inkscape folder, restart inkscape, and use that to build your g-code file.
Once you have your g-code file, you could send it to grbl using Universal-G-Code-Sender, or other grbl software like Grbl Controller.